

Fire Table Transformations: Commercial Property Success Stories
Key Takeaways
- Properties see rapid, measurable gains; ~30% higher guest satisfaction, ~42% ADR lifts, and up to 69% RevPAU within the first season, often achieving 9–18 month payback.
- Commercial-grade specs; 304 stainless steel, ANSI/CSA certifications, and 50-year structural warranties, prevent the catastrophic failures common with residential models.
- Results hinge on programming and placement: 22–24" seating offsets, glass wind guards that cut fuel use ~50%, and premium fire-side seating (+$25–$50/table) that elevates experience and NOI.
- Over its lifespan, a $50K commercial table serving ~50K guests annually costs about $0.10 per interaction. It avoids the replacement and reputational costs of ~$10K residential units that fail every three years.
- Success depends on vendor choice, prioritizing luxury-hospitality portfolios, unlimited customization, and domestic manufacturing to meet specs and timelines without 9–24 month delays.
Fire tables aren't patio decorations; they're strategic investments that transform underperforming outdoor spaces into profit centers. While competitors settle for commodity furniture that fails mid-season, properties specifying commercial-grade fire tables capture measurable revenue increases: hotels see 69% RevPAU gains, restaurants boost guest checks 30%, and multifamily properties command 5-8% rent premiums.
The difference lies in understanding what separates hospitality-proven fire table equipment from residential-grade alternatives that create operational nightmares.
What Is A Commercial Fire Table, And How Does It Differ From Fire Pits And Patio Heaters?
Commercial fire tables combine warmth, ambiance, and functionality in ways fire pits and patio heaters cannot. Built with 304 stainless steel and GFRC materials rated for 24/7 hospitality use, they withstand 50,000+ guest interactions while maintaining a pristine appearance. Unlike residential models, commercial units carry ANSI/CSA certifications and feature automatic safety shut-offs required for public spaces. In luxury environments, that combination translates into measurable guest dwell time increase and premium brand experience upgrades.”
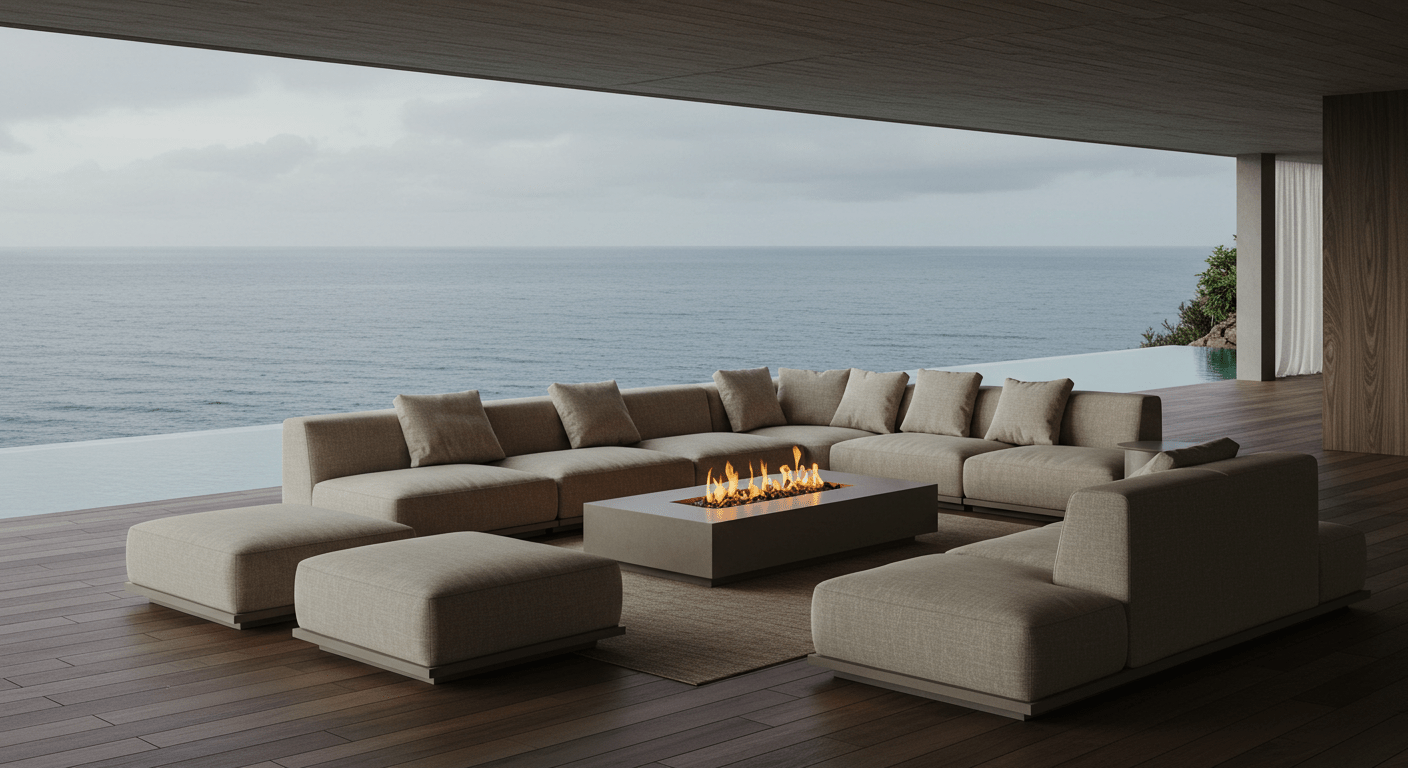
Fire tables serve drinks and appetizers on their wide ledges while creating intimate conversation zones. Patio heaters only provide heat. Fire pits offer ambiance but lack functional surfaces. Commercial fire tables deliver both, transforming dead space into revenue-generating amenity areas that photograph beautifully and drive social media engagement.
Amenity Placement Contexts
-
Rooftop: Create intimate zones in large spaces using linear fire tables (per Sensei Lānaʻi Four Seasons case)
-
Courtyard: Central focal point encouraging conversation with 22-24 inch seating distance
-
Pool deck: Extend seasonal usage with a 30% boost in guest check sales potential
-
Sidewalk café: Street-side activation with a minimum 10-25 feet clearance from structures
-
Plaza: Create Instagram-worthy moments that showcase before-and-after outdoor spaces (40% of property photo engagement comes from outdoor spaces)
Why Do Fire Tables Increase Dwell Time, Average Check, And NOI?
Fire tables trigger measurable behavior shifts that directly impact revenue. Guests linger longer, order additional rounds, and return specifically for the outdoor experience. The Grand View Hotel documented a 30% guest satisfaction increase after installation, with notable weekend booking growth during shoulder seasons.
Behavior Shift & KPI Deltas
|
Metric |
Baseline |
Post-Install |
Measurement Window |
Notes |
|
Dwell time |
Standard |
+30% (Grand View Hotel) |
Cold season months |
Enhanced ambiance factor |
|
Party size |
Standard |
Data needed |
Peak hours |
Fire tables encourage group gatherings |
|
UGC volume |
Baseline |
40% of property photos feature outdoor spaces |
Ongoing |
Instagram moment creation |
|
Review velocity |
Standard |
Notable rise in weekend bookings |
Post-installation |
Grand View Hotel case |
|
Average check |
$X |
+30% for restaurants with fire features |
Year-round |
Custom Fire Art 2018 data |
|
Table turns |
Standard |
Extended season usage |
Shoulder months |
Weather-dependent |
Hospitality vs F&B Impact Snapshot
|
Asset Type |
KPI |
Typical Uplift Range |
Evidence Source/Notes |
|
Hotels/Resorts |
ADR |
+42% |
Vacation rental data with fire pits |
|
Hotels/Resorts |
RevPAU |
+69% |
Properties with fire amenities |
|
Restaurants |
RevPASH |
+30% guest check sales |
Custom Fire Art study |
|
Vacation Rentals |
Revenue per bedroom |
+57% |
Market research data |
Which Asset Classes Gain The Highest ROIFrom Fire Tables?
Hotels and restaurants see immediate revenue impact, while multifamily properties capture long-term value through increased rents and property premiums. The 78% ROI documented for outdoor fire features makes them among the highest-returning amenity investments. Properties targeting the luxury segment report fire tables as essential differentiators, not optional upgrades.
-
Hotels: Primary KPI: RevPAU (+69% potential), Peak: Evening/shoulder season, Program: Wellness unwinding (Sensei Lānaʻi model)
-
Restaurants: Primary KPI: Guest check sales (+30%), Peak: Dinner service/weekends, Program: S'mores experiences
-
Multifamily: Primary KPI: Property value (+5-8% premium), Peak: Evening social hours, Program: Resident events
-
Offices/Coworking: Primary KPI: Occupancy retention, Peak: After-work networking, Program: Rooftop happy hours
-
Retail/Mixed-use: Primary KPI: Dwell time extension, Peak: Weekend evenings, Program: Seasonal activations
Which Fire Table Types, Fuels, And Outputs Work Best For Commercial Use?
Commercial properties need fire tables that deliver consistent performance through thousands of guest interactions. The right fuel choice balances operating costs, maintenance requirements, and local permit restrictions. Natural gas dominates luxury hotels for its convenience, while rooftop venues favor propane's flexibility.
Fuel Comparison
|
Fuel |
Pros |
Cons |
Opex Profile |
Best Contexts |
Permit Notes |
|
Natural Gas |
Convenient, low operating cost, high BTU (up to 250,000) |
Professional installation required |
Lowest ongoing cost |
Fixed commercial installations |
Local gas line permits |
|
Propane |
Portable, easy install |
Tank replacement needed |
Moderate, tank refills |
Flexible layouts, rooftops |
Storage requirements |
|
Bioethanol |
Eco-friendly, clean burn |
Low heat (3,000 BTU) |
Higher fuel cost |
Indoor/outdoor transition |
CPSC December 2024 warnings |
Heat Output & Geometry Selection
|
Climate Band |
Seating Radius |
Recommended BTU |
Burner Geometry |
Wind Exposure Note |
|
Coastal/Windy |
3-4 ft |
60,000-90,000 |
Linear/rectangular |
Glass wind guards essential |
|
Moderate |
4-6 ft |
40,000-60,000 |
Round/square |
Natural windbreaks preferred |
|
Desert/Mild |
6-8 ft |
30,000-40,000 |
Any geometry |
Aesthetic priority over heat |
Material/Finish Durability Guide
-
GFRC: Low maintenance, UV-stable, freeze-thaw resistant, premium aesthetic
-
304 Stainless Steel: Marine-grade for coastal (Cooke 50-year guarantee), minimal maintenance
-
Natural Stone: High-end appearance, requires sealing, and weight considerations
-
Powder-coat aluminum: Budget-friendly, moderate salt resistance, 5-7 year lifespan
-
Teak: Luxury aesthetic, quarterly oiling required, not for high-traffic commercial
What Codes, Safety Rules, And Accessibility Requirements Typically Apply?
Commercial fire table installations must satisfy multiple regulatory layers, from NFPA fire codes to ADA accessibility standards. Properties face liability exposure and potential shutdowns for non-compliance. Smart operators engage code consultants early to avoid costly retrofits after inspection failures.
Common Requirements & References
|
Topic |
Typical Requirement |
Reference |
Field Note |
|
Clearances |
10-25 ft from structures, 21 ft from vegetation |
NFPA/Local codes |
Verify local requirements |
|
Overhead clearance |
72 inches minimum for gas tables |
Fire Pit Surplus guidelines |
7-10 ft recommended |
|
Cylinder storage |
Ventilated enclosure required |
IFC |
Temperature-controlled areas |
|
Ignition controls |
Emergency shut-off within reach |
ANSI Z21.97, CSA 2.41 |
Commercial certification required |
|
ADA reach/approach |
48" max height, 36" clear path |
ADA |
Consider transfer surfaces |
Layout Safety & Access Checklist
-
✓ Minimum 36" egress widths maintained
-
✓ Wind mitigation barriers (glass guards for erratic flames)
-
✓ Tip-resistance testing for high-traffic areas
-
✓ 42" guard heights where required
-
✓ Tactile wayfinding for dark deck navigation
What Are The Main Steps To Plan And Deliver A Fire Table Transformation?
Commercial fire table projects span 9-24 months from concept to guest activation. Properties that rush vendor selection face opening delays costing $200,000+ in pre-booked revenue. The most successful transformations follow systematic planning that anticipates common failure points, especially the extended lead times for custom commercial pieces.
10-Step Project Roadmap
|
Step |
Objective |
Owner |
Milestone |
Risk Watch-Outs |
|
1 |
Site assessment |
PM |
Feasibility confirmed |
Utility access constraints |
|
2 |
Design development |
Designer |
Concept approval |
Brand alignment gaps |
|
3 |
Permitting |
GC |
Permits secured |
3-6 month delays possible |
|
4 |
Vendor selection |
PM |
Contract signed |
Lead times (9-24 months typical) |
|
5 |
Customization |
Designer |
Final specs approved |
Scope creep on custom pieces |
|
6 |
Manufacturing |
Vendor |
Production complete |
Quality control checkpoints |
|
7 |
Site preparation |
GC |
Infrastructure ready |
Weather delays |
|
8 |
Installation |
Vendor/GC |
Units operational |
Damage during delivery |
|
9 |
Commissioning |
Ops |
Staff trained |
SOP documentation gaps |
|
10 |
Launch |
Marketing |
Guest activation |
Soft opening recommended |
How Do Real-World Case Studies Prove Impact Across Property Types?
Properties demand proof before investing $50,000+ in fire table transformations. Decision-makers visit existing installations and call peer properties; 98% require direct client references before signing contracts. These documented successes validate ROI projections and justify premium pricing to ownership.
Case Study Roll-Up
|
Asset |
Intervention |
CapEx |
KPI Tracked |
Result (Δ) |
Time to Impact |
Notes |
|
Grand View Hotel |
Fire pit installation |
Market rate |
Guest satisfaction |
+30% |
Immediate |
Weekend bookings surge |
|
Sensei Lānaʻi Four Seasons |
Cooke Famosa tables & Mammoth pits |
Premium |
Guest reviews |
#1 Hawaii resort (Condé Nast) |
12 months |
Wellness program integration |
|
Casual dining (aggregate) |
Outdoor fire features |
Varies |
Guest check sales |
+30% |
3-6 months |
Per Custom Fire Art |
|
Vacation rentals |
Fire pit amenity |
$5-15K |
ADR/RevPAU |
+42%/+69% |
Booking season |
Premium positioning |
|
Multifamily |
Courtyard fire tables |
$20-50K |
Property value |
+5-8% |
12-24 months |
Resident satisfaction driver |
How Should Owners Budget CapEx, Installation, And OpEx (TCO)?
Smart operators calculate cost-per-guest-use over 10-year lifecycles, not upfront pricing. A $50,000 commercial fire table serving 50,000 annual guests costs $0.10 per interaction over its lifespan. Compare that to replacing $10,000 residential-grade tables every three years, plus reputation damage from mid-season failures.
CapEx Breakdown
|
Line Item |
Cost Range |
Cost Driver |
|
Fire table unit |
$5K-$50K |
Size, material (GFRC premium), customization |
|
Utility run (gas) |
$2K-$20K |
Distance from main, trenching requirements |
|
Slab/deck reinforcement |
$3K-$15K |
Structural requirements for 500-2000 lb units |
|
Wind screens |
$1K-$5K |
Height, material (tempered glass) |
|
Smart controls |
$2K-$10K |
App integration, automation level |
Cost Swing Variables
-
Fuel choice: Natural gas installation +$10-20K vs propane flexibility
-
Utility distance: Every 50 ft adds $1-2K in trenching
-
Coastal exposure: Marine-grade materials add 30-50% premium
-
Custom design: Bespoke solutions (Cooke model) command 2-3x standard pricing
-
Lead times: Rush delivery adds 25-40% premium
Ongoing Costs & Intervals
|
Item |
Frequency |
Annual Estimate |
Notes |
|
Fuel (natural gas) |
Monthly |
$200-$500 |
Lowest operating cost |
|
Fuel (propane) |
Bi-weekly peak |
$800-$2000 |
Tank rental additional |
|
Professional cleaning |
Quarterly |
$400-$800 |
Maintain warranty |
|
Cover replacement |
3-5 years |
$200-$500 |
UV degradation |
|
Burner service |
Annual |
$300-$600 |
Certification maintenance |
How Do You Specify For Performance, Durability, And Brand Consistency?
Specification errors create operational nightmares. One property's $15,000 fire table collapsed during a wedding reception, forcing them to comp the entire $50,000 event. Another delayed opening, three months waiting for wrong-sized units, losing $200,000 in pre-booked revenue. Precise specifications prevent catastrophic failures.
Dimensions & Clearances Checklist
-
✓ 22-24 inch seating offset for comfort
-
✓ 18" minimum knee clearance
-
✓ 48" aisle widths (ADA compliance)
-
✓ 72" overhead minimum (gas units)
-
✓ 10-25 ft to combustible structures
Finish Selection Matrix
|
Finish |
Best Climates |
Wear Level |
Cleaning Cadence |
Aesthetic Fit |
|
304 Stainless |
Coastal, all |
Minimal (50-year) |
Monthly |
Modern luxury |
|
GFRC |
All climates |
Very low |
Quarterly |
Contemporary |
|
Powder coat |
Inland, dry |
Moderate |
Bi-monthly |
Budget-conscious |
|
Natural stone |
Mild, covered |
Low with sealing |
Annual seal |
Traditional luxury |
Must-Have Accessories
-
✓ Glass wind guards (reduce fuel use 50% per CROSSFIRE data)
-
✓ Weather-resistant covers
-
✓ Timer controls for automatic shut-off
-
✓ Tank enclosures matching table finish
-
✓ Seismic anchor kits (California requirement)
How Do You Operate Safely And Manage Risk Long-Term?
Fire table failures destroy reputations instantly. One malfunction during a VIP event triggers insurance claims, negative reviews, and ownership scrutiny. Properties protect their investment through documented protocols, preventive maintenance schedules, and staff training that eliminates operator error. The difference between 50-year performance and premature failure lies in consistent operational discipline.
Training & SOPs Checklist
-
✓ Daily startup/shutdown protocols documented
-
✓ Ignition system checks (weekly)
-
✓ Guest incident response procedures
-
✓ Visible safety signage per local codes
-
✓ Staff certification tracking
Inspection Schedule
|
Component |
Check |
Frequency |
Pass/Fail Action |
Warranty Note |
|
Burner ports |
Blockage |
Weekly |
Clean/service |
Maintains coverage |
|
Gas connections |
Leak test |
Monthly |
Immediate repair |
Safety critical |
|
Ignition system |
Function test |
Weekly |
Replace if 3 fails |
Electronic components |
|
Media/glass |
Integrity |
Monthly |
Replace damaged |
Aesthetic/safety |
|
Structure |
Stability |
Quarterly |
Professional assess |
50-year guarantee (Cooke) |
Contingency Protocols
-
High wind (>25mph): Automatic shut-off, cover installation
-
AQI >150: Suspend operation, communicate to guests
-
Burn bans: Immediate compliance, alternative programming ready
How Do You Market The Amenity To Maximize ROI?
Outdoor fire tables create revenue opportunities beyond warmth and ambiance. Properties charging $25-50 premiums for fire-side seating report full bookings even in shoulder seasons. Smart operators build programming that transforms a static amenity into dynamic profit centers, from s'mores experiences to sunset tastings that drive 30% check increases.
Revenue Programs
-
Premium fire-side seating (+$25-50/table surcharge)
-
S'mores packages ($15-25 per group)
-
Private fire table bookings ($200-500 minimum)
-
Sunset happy hour programming (drives 30% check increase)
-
Seasonal tasting events around fire features
Visibility & Amplification
-
Instagram moment curation (40% of property photos)
-
Review platform prompts mentioning fire amenity
-
Loyalty program exclusive fire-side reservations
-
Digital wayfinding to "discover our fire terrace"
-
Influencer activations during golden hour
How Do You Calculate ROI, Payback, And NOI Uplift Credibly?
Ownership demands hard numbers, not marketing promises. Properties tracking fire-adjacent room premiums, weather-normalized check averages, and tenant retention rates build credible business cases. Most commercial installations achieve 9-18 month payback when properly programmed and marketed.
KPI Formulas By Sector
|
Sector |
Primary KPI |
How to Measure |
Attribution Tip |
|
Hotels |
RevPAU increase |
(Post-install RevPAU / Baseline) -1 |
Track fire-adjacent room premiums |
|
Restaurants |
Check average lift |
Fire-side tables vs standard |
Weather-normalize data |
|
Multifamily |
NOI impact |
Rent premium × units × occupancy |
Survey willingness-to-pay |
|
Mixed-use |
Tenant retention |
Renewal rate YoY |
Exit survey attribution |
Payback Scenarios
Across commercial fire table case studies, these scenarios are typical.
|
Scenario |
CapEx |
Incremental NOI/mo |
Payback (mo) |
Sensitivity Notes |
|
Boutique hotel (42% ADR lift) |
$75K |
$8,500 |
9 |
Seasonal variation ±30% |
|
Restaurant (30% check increase) |
$40K |
$4,000 |
10 |
Weather-dependent |
|
Luxury multifamily |
$100K |
$5,500 |
18 |
5-8% rent premium capture |
Seasonality Factors & Mitigations
-
Weather impact: 78% ROI assumes 8-month usage in temperate climates
-
Programming cadence: Weekly events maintain momentum
-
Cover strategy: Extend season 2-3 months with proper wind/weather protection
Can Fire Tables Align With Sustainability And ESG Goals?
ESG initiatives demand measurable emissions reductions. Properties balance guest experience with environmental commitments through high-efficiency burners and smart controls. Modern CROSSFIRE technology delivers 200% larger flames using 50% less gas, satisfying both sustainability metrics and guest expectations for dramatic fire features.
Design & Control Tactics That Cut Emissions
-
Timer controls reduce the runtime 40%
-
Glass wind screens cut fuel consumption by 50% (CROSSFIRE technology)
-
Zone-based activation for partial occupancy
-
High-efficiency burners: 200% larger flames with 50% less gas
-
American-made products reduce shipping emissions (Cooke model)
Low-Emission Options
|
Tech |
Emission Profile |
Op Cost |
Suitability |
Caveats |
|
Electric infrared |
Zero on-site |
High ($$$) |
Urban rooftops |
No flame aesthetic |
|
Bioethanol |
Carbon-neutral claim |
Highest |
Small scale |
CPSC safety concerns |
|
RNG blend |
50-90% reduction |
Moderate |
All contexts |
Certification needed |
ESG Documentation Checklist
-
✓ BTU consumption tracking for reporting
-
✓ Renewable Natural Gas certificates filed
-
✓ Local sourcing documentation (supports B-Corp goals)
-
✓ Maintenance logs proving efficiency
What Common Mistakes Derail Fire Table Projects?
Properties lose $200,000+ from avoidable specification errors. One resort ordered fire tables too tall for ADA compliance, requiring complete replacement. Another place units in wind tunnels, tripling fuel costs. These mistakes damage budgets, delay openings, and embarrass decision-makers who chose the wrong vendors or ignored critical details. Each error below shows how weak planning undermines amenity-driven ROI.
Sizing & Layout Errors
-
BTU undersizing: Specifying residential-grade (30K BTU) for commercial needs (60K+)
-
Seating too far: Beyond 24" reduces heat benefit and intimacy
-
Wind tunnel placement: Ignoring prevailing winds increases fuel use 3x
-
Ignoring sightlines: Blocking premium views with tall fire features
Compliance Misses
-
Clearance violations: Missing 21 ft vegetation requirement
-
Inadequate egress: Fire table blocking emergency exit paths
-
ADA non-compliance: Tables over 48" height without alternatives
-
Storage violations: Propane tanks in non-ventilated spaces
Operational Pitfalls
-
Complex smart controls without backup manual operation
-
No documented SOPs leading to inconsistent operation
-
Single-vendor dependency without local service support
-
Missing seasonal shutdown procedures risk freeze damage
What Checklists Streamline Execution From Pre-Design To Operations?
Successful fire table projects follow systematic checklists that prevent costly surprises. Properties using these protocols avoid the structural failures, permit delays, and maintenance disasters that plague rushed installations. Every checkmark protects against specific failure modes learned from industry disasters.
Pre-Design Audit & Utilities
-
✓ Structural capacity verified (units can weigh 2000+ lbs)
-
✓ Gas line capacity assessed
-
✓ Electrical for ignition available
-
✓ Drainage plan for deck/patio
-
✓ Prevailing wind study completed
Permits, Inspections, Commissioning
-
✓ Building permit secured
-
✓ Gas permit and inspection scheduled
-
✓ Fire marshal approval obtained
-
✓ Commercial certification (ANSI Z21.97/CSA 2.41)
-
✓ Insurance notification and coverage confirmed
Maintenance & Seasonal Startup/Shutdown
-
✓ Spring: Clean burners, test ignition, check connections
-
✓ Summer: Monthly cleaning during peak use
-
✓ Fall: Deep clean, inspection, cover installation
-
✓ Winter: Drain gas lines (freeze zones), secure covers
What Are The Next Steps To Start A 90-Day Pilot?
Smart operators kick off a 90-day pilot by vetting vendors on five must-haves: a luxury hospitality track record (think Four Seasons or Ritz-Carlton), true customization without minimums, a 50-year structural warranty vs. the 3-year norm, dependable lead times that fit 9–24-month planning, and a local service network for peak-season support.
The impact is proven; commercial-grade fire tables lift key revenue metrics 30–69%, with the market trending toward $9.6B by 2030, so choose a partner built for luxury and 50-year reliability. Ready to turn outdoor spaces into revenue-generating customer experiences? Connect with Cooke Furniture to discuss your property’s plan.
Ready to transform your outdoor spaces into revenue-generating guest experiences with a luxury fire table centerpiece? Connect with Cooke Furniture's team to discuss your property's specific requirements.


