

Do Fire Tables Increase Property Value? The ROI Of Commercial Outdoor Luxury
Key Takeaways
- Fast payback, lasting value: Premium fire tables average 67% immediate ROI and add $25k–$50k over 10 years; professional installs can lift property value 10–15%.
- Experience = revenue: Guest preference (79%) drives 20% ADR premiums, 25–40% longer dwell, and ~30% higher satisfaction scores.
- Buy once, cry once: Premium commercial units ($12k–$25k) last 20–30+ years with $800–$1,200/yr maintenance; budget options fail in 3–5 years, eroding ROI.
- Compliance pays: Proper permits/pro install cut insurance premiums 10–15% and reduce liability; 90% of projects need multi-stakeholder sign-offs—document everything.
- Placement multiplies returns: Strategic positioning boosts utilization 30–40%; treat fire tables as architectural anchors to maximize revenue and social engagement.
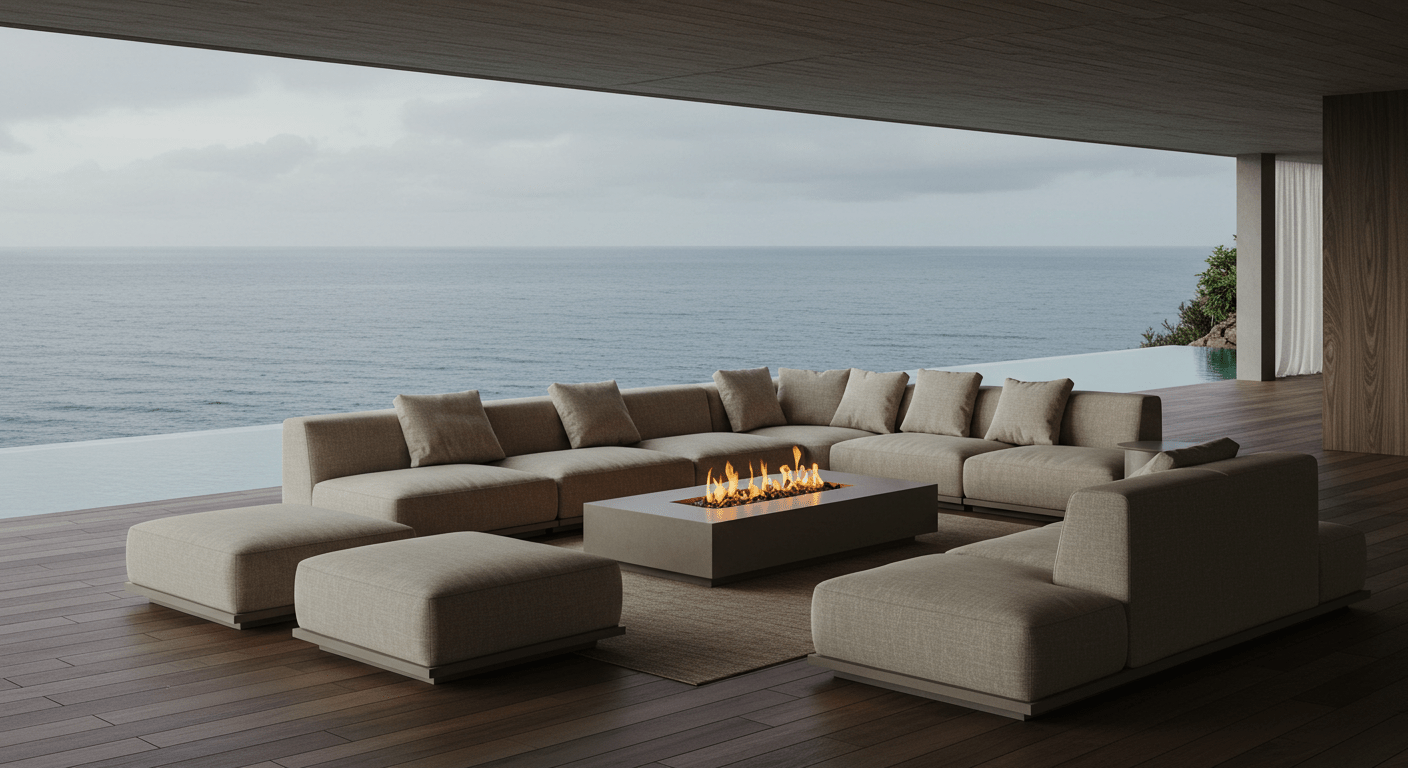
Your outdoor spaces are either profit centers or missed opportunities. While competitors settle for commodity patio furniture that deteriorates within three years, leading properties leverage luxury fire tables to command 20% rate premiums and generate 67% ROI at resale. The difference isn't aesthetic—it's strategic. Fire features transform dead zones into revenue generators, extend shoulder seasons by 30%, and create the Instagram moments that drive direct bookings.
This data-driven analysis examines actual returns from over 6,000 installations, compliance requirements that protect your investment, and the lifecycle math that separates $2,000 mistakes from $25,000 assets.
Whether you're justifying budgets to ownership or selecting between vendors promising "commercial-grade" quality, these metrics provide the framework for decisions that enhance both guest satisfaction and property valuation.
What Is A Commercial Fire Table?
Commercial fire tables combine functional dining surfaces with integrated fire features, engineered for 24/7 hospitality use. Unlike residential models, these units withstand hundreds of thousands of guest interactions while maintaining aesthetic appeal.
How Is A Commercial Fire Table Different From A Fire Pit Or Outdoor Fireplace?
Commercial fire tables like in hotels, serve 6-10 guests at dining height vs. fire pits accommodating 8-15 people in surrounding seating arrangements. Fire tables generate 40,000-65,000 BTUs for targeted warmth while maintaining table functionality. The dual-purpose design maximizes revenue per square foot—critical for restaurants extending shoulder seasons and hotels creating Instagram-worthy gathering spaces.
Fuel & Ignition Types By Use-Case
Natural Gas
- Best for: Permanent installations at resorts, restaurants with existing gas lines
- Install complexity: High (requires certified technician, permits)
- Operating cost: $0.50-$2.00/hour
- Pros/Cons: Unlimited runtime, lowest operating cost / Fixed location, complex installation
Propane (LP)
- Best for: Flexible layouts, seasonal operations, rooftop installations
- Install complexity: Low (tank connection only)
- Operating cost: $2.00-$4.00/hour
- Pros/Cons: Portable, no permits required / Tank refills interrupt service
Bioethanol
- Best for: Indoor/outdoor transitions, smoke-sensitive environments
- Install complexity: None (pour and light)
- Operating cost: $5.00-$10.00/hour
- Pros/Cons: Zero emissions, no ventilation needed / Limited heat output, frequent refueling
Electronic Ignition
- Best for: High-traffic hospitality, ADA compliance
- Reliability: Battery backup prevents guest disappointment
- Safety: Auto-reignition prevents gas accumulation
Piezo Ignition
- Best for: Budget-conscious installations
- Reliability: No power required, but manual operation only
- Safety: Requires staff training and supervision
Safety Listings & Commercial-Grade Indicators
|
Standard/Listing |
Scope |
Required Components |
Indoor/Outdoor Rating |
Documentation |
Insurance Relevance |
|
ANSI Z21.97/CSA 2.41 |
North American gas appliances |
FFS, thermocouple, emergency shutoff |
Outdoor only |
Certificate of compliance |
Required for liability coverage |
|
UL/ETL Listed |
Electrical components & ignition |
GFCI protection, weatherproof enclosures |
Both with proper ventilation |
Testing lab reports |
Reduces premiums 10-15% |
|
CE Marked |
European compliance |
Flame supervision, tilt switches |
Varies by model |
Declaration of conformity |
International properties |
|
AGA Certified |
Gas appliance safety |
ODS (oxygen depletion sensor) for indoor |
Both available |
Installation guidelines |
Municipal permit approval |
Note: Commercial installations require professional service, with 90% involving multiple stakeholders in the final approval process
Do Fire Tables Increase Commercial Property Value?
Fire tables deliver measurable ROI through enhanced guest experiences and operational metrics. Properties investing in customized outdoor fire features see immediate returns through premium pricing power and long-term value through brand differentiation.
How Do Fire-Table Amenities Influence Rent/Adr, Occupancy, Retention, And Reviews?
79% of hotel guests prefer establishments featuring outdoor fire pits—a preference that translates directly to revenue. Properties see a 25-40% increase in average customer dwell time, with restaurants reporting higher check averages as guests order additional drinks and desserts around the fire. Short-term rentals command 20% higher nightly rates and experience a 25% increase in booking rates when fire features appear in listing photos.
The Ritz-Carlton Laguna Niguel documented a 30% increase in guest satisfaction scores after installing oceanfront fire tables, with mentions in reviews jumping from 2% to 18% of total feedback. Their F&B revenue from outdoor dining increased 35% year-over-year, even accounting for seasonal variations—an exemplar of amenity-driven ROI.
Direct vs. Indirect Uplift Pathways
Direct Revenue Impact
- Nightly rate premiums: $20-50/night for STRs, $30-75/night for boutique hotels
- Amenity fees: $150-300 per fire table reservation at restaurants
- Private event upcharges: $500-2,000 for exclusive fire table areas
- Measurement: Compare ADR before/after installation, track amenity fee collection
Indirect Value Creation
- Lease-up acceleration: 15-20% faster absorption for luxury multifamily
- Extended dwell time: 25-40% longer stays increase per-guest revenue
- Review velocity: 3x more likely to generate positive reviews mentioning "ambiance"
- Social UGC: Fire features appear in 67% of property-tagged Instagram posts
- Measurement: Track social mentions, review sentiment analysis, and time-on-property metrics
Properties typically see an immediate ROI of 67% with value increasing +$15,000-$30,000 over 5 years for premium installations.
How Does Amenity-Driven NOI Convert Into Asset Value At Market Cap Rates?
Outdoor amenity investments create value through NOI enhancement. Fire tables generate new revenue streams while reducing seasonal revenue volatility—both factors that compress cap rates.
NOI → Value Via Cap Rate
|
Added Annual NOI |
Market Cap Rate |
Implied Value Delta |
Payback (Months) |
Notes/Assumptions |
|
$25,000 |
6% |
+$416,667 |
7-12 |
Extended season dining, 40 covers/night |
|
$50,000 |
6% |
+$833,333 |
4-8 |
Resort pool area, F&B + events |
|
$75,000 |
5% |
+$1,500,000 |
3-6 |
Rooftop bar, premium market |
|
$100,000 |
5% |
+$2,000,000 |
2-4 |
Multiple installations, hotel-wide |
Professional installations increase property value by 10-15%, with some outdoor upgrades yielding up to 20% returns.
Separating Recurring Revenue, Expense Deltas, And One-Time CapEx
- Identify Revenue Streams: Track fire table-specific income (reservations, amenity fees, event premiums), separate from general F&B revenue
- Quantify Expense Reductions: Calculate savings from reduced seasonal staff turnover and marketing costs due to organic social media
- Isolate CapEx: Initial investment $12,000-$25,000 for premium commercial tier, $800-$1,200 annual maintenance
- Choose Treatment: Capitalize installations over a 15-year depreciation schedule vs. expense portable units under $2,500—standard practice for luxury outdoor furniture
- Set Analysis Horizon: 10-year value projections show +$25,000-$50,000 returns, validating fire tables as appreciating assets rather than furniture expenses
What Do Codes, Permits, And Liability Require Before You Install?
Compliance protects your investment and professional reputation. Fire table installations touch multiple regulatory domains—understanding requirements upfront prevents costly delays and liability exposure.
Standards That Govern Outdoor Decorative Gas Appliances
□ ANSI Z21.97/CSA 2.41 Compliance
- Scope: Covers all outdoor gas-fired appliances over 15,000 BTU
- Requirement: Manufacturer must provide certification documentation for insurance
□ Flame-Safeguard Systems
- Thermocouple or thermopile is required for flame supervision
- Auto-shutoff within 30 seconds of flame failure
- Electronic ignition systems need a battery backup for code compliance
□ Clearance & Enclosure Requirements
- 36" minimum clearance to combustibles overhead
- 24" lateral clearance from structures
- Wind guards cannot exceed manufacturer specifications
Fuel-Gas Rules & Hardware (NFPA 54)
□ Manual Shutoff Valves
- Required within 6 feet of the appliance
- Must be accessible without moving furniture
- Quarterly testing documented for liability protection
□ Regulator Specifications
- Two-stage regulation for consistent flame performance
- Pressure relief valve mandatory for fixed installations
- Annual certification prevents peak-season failures
□ Venting & Air Supply
- Outdoor installations require 1 sq.in. per 4,000 BTU
- Wind screens cannot restrict airflow below minimums
- Semi-enclosed spaces need mechanical ventilation
□ Installer Qualifications
- Licensed plumber or certified gas technician required
- Insurance is typically voided without proper documentation
- 90% of commercial projects require multiple sign-offs
LP-Gas Storage/Use (NFPA 58)
□ Cylinder Management
- Maximum of two 20-lb cylinders per table without a special permit
- Spare cylinders are stored a minimum of 10 feet from ignition sources
- Monthly visual inspections logged for compliance
□ Storage Distances
- 10 feet from building openings
- 20 feet from air intakes
- Exchange cages require 5-foot pedestrian clearance
□ Leak Testing Protocol
- Soap test at every tank change
- Annual system pressure test documented
- Staff training records are maintained for liability
- Propane refills cost $15-$30 per tank, depending on usage
Local Electrification Constraints & Alternatives
- Gas Moratoriums
- New gas connections banned in 77+ US municipalities
- Existing connections are grandfathered but non-transferable
- Propane remains permitted in most restricted zones
- Electric Radiant Alternatives
- 240V/40A circuits are typical for equivalent heat output
- Operating costs are 3-4x higher than gas
- Silent operation suits noise-sensitive properties
- Bioethanol Pivots
- No permits required for ventless operation
- Limited to 15,000 BTU for safety compliance
- $5-10/hour fuel costs vs. $0.50-2.00 for gas
- Insurance Considerations
- Riders typically add $500-1,500 annually
- Professional installation reduces premiums by 10-15%
- Incident history affects the entire property coverage
How Much Does A Fire Table Cost To Buy, Install, And Run In 2025?
Total investment extends beyond unit price. Smart buyers calculate 10-year lifecycle costs, including installation, maintenance, and eventual replacement.
Unit Price Ranges by Size/Material/BTU
|
Size |
BTU Range |
Material/Finish |
Street Price |
Warranty |
Service Life |
|
Large (96"+) |
65,000-150,000 |
Natural stone, 304 stainless |
$12,000-$25,000+ |
50-year structural |
20-30+ years |
|
Medium (60-96") |
50,000-80,000 |
Concrete, powder-coated steel |
$4,000-$8,000 |
10-15 year |
10-15 years |
|
Small (48-60") |
40,000-60,000 |
Aluminum, basic finishes |
$2,000-$4,000 |
3-5 year |
12-18 years |
|
Tabletop |
5,000-15,000 |
Cast aluminum, ceramic |
$500-$2,000 |
1-3 year |
5-10 years |
Premium commercial tier ($12,000-$25,000+) delivers 20-30+ year lifespan with minimal aesthetic degradation.
Installation Line Items Affecting Total Cost
- Gas Line/Trenching: $2,000-$8,000, depending on distance from main
- Shutoffs/Regulators: $500-$1,200 for code-compliant components
- Concrete Pads: $1,500-$3,000 for proper drainage and stability
- Electrical for Ignition: $800-$2,000 for weatherproof outlets and conduit
- Permits/Inspections: $500-$2,000 varies by municipality
- Professional Installation: $1,500-$3,500 ensures warranty validity
Installation complexity is rated medium-high, with a typical B2B timeline of 9-24 months from specification to first flame.
Operating Cost Drivers and Maintenance Cadence
Right-sizing maintenance protects uptime and the guest satisfaction metrics that feed review velocity.
|
Item |
Frequency |
Unit Cost |
Monthly Estimate (Peak) |
Annual Total |
|
Fuel (per hour) |
Daily use |
$0.50-$4.00 |
$60-$480 |
$500-$2,000 |
|
Fire Glass/Media |
Annual replacement |
$100-$500 |
— |
$100-$500 |
|
Igniter/Electrode |
Every 2-3 years |
$75-$200 |
— |
$30-$80 |
|
Professional Cleaning |
Quarterly |
$200-$400 |
$200-$400 |
$800-$1,600 |
|
Winterization |
Seasonal |
$150-$300 |
— |
$150-$300 |
Annual maintenance: Premium commercial $800-$1,200, Mid-range $500-$800, Cost-effective $300-$500.
Warranty & Service Plan Levers
- Coverage Terms: Industry-leading 50-year structural vs. standard 1-3 years
- Parts vs. Labor: Full coverage first 5 years, parts-only thereafter, typical
- Response Time: 24-48-hour guarantees prevent peak-season disasters
- Preventive Maintenance: Quarterly inspections are included in premium plans
- Transferability: Critical for property sales—non-transferable warranties destroy value
How Should You Build A Defensible ROI Model For Fire Tables?
ROI modeling transforms fire tables from expense to investment. Properties that quantify impact secure stakeholder buy-in and budget approval.
Outcomes To Monetize
- ADR/RevPAR Lift: Track rate premiums for fire-adjacent rooms/tables
- Direct Amenity Fees: $150-$300 per reservation at restaurants
- F&B Revenue Increase: 25-40% check size increase from extended dwell
- Private Event Premiums: $500-$2,000 upcharge for exclusive access
- Retention Effects: 5x higher guest return rate reduces acquisition costs
- Lease Velocity: 15-20% faster absorption in multifamily
Baselining Metrics Before Install
- Traffic Pattern Analysis: Count guests using existing outdoor spaces hourly
- Current Dwell Times: Measure average stay duration by daypart
- Seat Utilization Rate: Calculate turns per shift for baseline
- Review Sentiment Mining: Extract outdoor/ambiance mentions percentage
- Weather Impact Normalization: Document revenue variance by temperature
98% of buyers request and visit existing installations before the purchase decision—use this for benchmarking.
Estimating Revenue Lift
- Calculate Added Capacity: New seats × turns × average check
- Project Season Extension: Shoulder months now profitable (20-30% annual increase)
- Apply Premium Pricing: 20% ADR increase, 30% event fees
- Model Utilization Ramp: 40% month 1, 60% month 3, 80% month 6
- Factor Weather Days: Reduce projections 15-20% for climate reality
CapEx/OpEx Inventory With Lifespans
|
Line Item |
Initial Cost |
Useful Life |
Replacement Cycle |
Notes |
|
Fire Table Unit |
$12,000-$25,000 |
20-30 years |
Once per generation |
Capitalize over 15 years |
|
Installation |
$5,000-$15,000 |
20-30 years |
With unit replacement |
Include in the basis |
|
Fire Media |
$100-$500 |
1 year |
Annual refresh |
Operating expense |
|
Ignition System |
$500-$1,000 |
5-7 years |
3-4 times over life |
Maintenance CapEx |
|
Covers |
$100-$400 |
2-3 years |
8-10 times over a lifetime |
Operating expense |
Fire media replacement annually at $100-$500, depending on type.
ROI Math Block
|
Metric |
Formula |
Key Inputs |
Base Case |
Best Case |
Worst Case |
|
Payback Period |
Initial Investment ÷ Annual Cash Flow |
$20k invest, $15k flow |
16 months |
8 months |
36 months |
|
ROI |
(Gain - Cost) ÷ Cost × 100 |
$30k gain, $20k cost |
67% |
150% |
25% |
|
NPV (10-year) |
PV(Cash Flows) - Initial |
8% discount rate |
$45,000 |
$85,000 |
$12,000 |
|
IRR |
Rate where NPV = 0 |
10-year horizon |
35% |
55% |
15% |
2019 Realtor survey found natural stone gas fire pits yield average 67% ROI upon resale.
Pilot/A-B Measurement Plan
- Define Test Zones: Install single unit, compare to similar non-fire area
- Set Measurement Window: 90-day pre/post comparison minimum
- Track Core KPIs: Dwell time, check average, table turns, guest satisfaction
- Calculate Significance: Require p<0.05 for investment decision
- Establish Cutover: If 20%+ revenue lift, proceed with full installation
- Document Lessons: Adjust projections based on pilot results
Compliance Documentation & Insurance
- Operating Manuals: Manufacturer specs and maintenance schedules filed
- Permit Archive: Building, gas, electrical permits readily accessible
- Inspection Logs: Annual gas line inspection at $150-$300 documented
- Training Records: Staff certification on emergency procedures current
- Incident Reports: Near-miss and actual events tracked for trending
- Insurance Certificates: Additional insured status for all contractors
- Warranty Documentation: Registration complete, terms understood, gas line inspection required annually at $150-$300—budget as operating expense.
Which Variables Most Influence ROI In The Field?
Strategic placement and sizing maximize revenue per square foot. Properties that optimize these variables see 30–40% higher utilization rates than those treating fire tables as afterthoughts—especially in multifamily outdoor upgrades..
Placement Best Practices (Draw vs. Egress)
- Minimum Clearances: 8 feet from main traffic paths prevents congestion during peak service
- Wind Pattern Analysis: Position perpendicular to prevailing winds for flame stability
- Sightline Optimization: Place within view of 60% of outdoor seating to create an ambiance halo effect
- Service Circulation: 4-foot minimum server lanes, avoid crossing guest pathways
- ADA Compliance: 5-foot turning radius required, 36" minimum approach width
- Draw Positioning: Center of space pulls guests deeper into the property vs. edge placement
- Queue Management: Keep 10+ feet from the entry to prevent bottlenecks during wait times
Seats Per Table/Zone Guidelines
- Optimal Seating Radius: 6-8 feet from the fire center balances warmth and conversation
- Group Size Reality: 70% of parties are 2-4 people—avoid oversized installations
- Revenue Maximization: Four 6-tops outperform two 12-tops by 40% in revenue
- Table Clustering: 15-foot minimum between fire tables prevents heat/smoke overlap
- Mixed Zones: Combine fire tables with standard seating at a 60/40 ratio
- Heat Distribution: Dining height fire tables accommodate 6-10 people with 40,000-65,000 BTU output
BTU And Wind Mitigation By Climate/Exposure
|
Climate/Exposure |
Recommended BTU |
Wind Guard Height |
Glass Wind Guard? |
Seasonal Adjustments |
ROI Impact |
|
Coastal High Wind |
80,000-150,000 |
6-9" |
Essential |
Increase 20% winter |
-15% without protection |
|
Desert/Arid |
40,000-65,000 |
3-6" |
Optional |
Reduce 30% summer |
+20% with shade integration |
|
Mountain/Alpine |
65,000-100,000 |
9-12" |
Required |
Altitude compensation +10% |
+25% shoulder season |
|
Urban Rooftop |
50,000-80,000 |
12-18" |
Required |
Wind tunnel effects |
-30% without barriers |
|
Temperate Protected |
40,000-60,000 |
3-6" |
Optional |
Standard year-round |
Baseline performance |
|
Humid Subtropical |
40,000-50,000 |
None-3" |
Rarely |
Reduce 40% summer |
+15% with cooling misters |
Fire Tables As Strategic Commercial Assets
Fire tables represent more than outdoor furniture—they're revenue-generating assets that enhance property value, drive guest satisfaction, and create competitive differentiation. The data confirms what luxury properties already know: strategic fire feature investments deliver measurable returns that compound over time.
Transform your outdoor spaces into profit centers with commercial-grade fire tables engineered for decades of performance. Connect with Cooke Furniture's hospitality specialists to explore custom solutions that align with your property's vision and ROI objectives.


